About
At GCB Hub, we enhance the understanding of biomarkers and their causal connections with complex traits and diseases across global populations.
Science
PRISM: proteome-wide association with cis and trans pQTL models.
PRISM (Proteome-wide Regression Integrating cis and trans pQTL Summary statistics across Multiple loci) extends BLISS beyond the cis window. Each PRISM model predicts one protein's plasma level from its cis window (the encoding gene ± 1 Mb) together with its independent trans pQTL loci elsewhere in the genome, and is trained from pQTL summary statistics alone. Testing the models against GWAS summary statistics gives a proteome-wide association study. We trained PRISM models for two proteomic panels and tested them against 1,669 traits from the Million Veteran Program (MVP, European ancestry) and 2,754 disease endpoints from FinnGen release 13.
| Panel | Models | Tested | Cohort | Traits | Significant pairs | FDR 5% cutoff | Download |
|---|---|---|---|---|---|---|---|
| UKB-PPP (Olink) | 2,863 | 1,623 | MVP | 1,669 | 61,940 | p ≤ 1.14e-3 | TSV |
| FinnGen R13 | 2,754 | 8,440 | p ≤ 9.48e-5 | TSV | |||
| deCODE (SomaScan) | 4,698 | 1,965 | MVP | 1,669 | 54,703 | p ≤ 8.34e-4 | TSV |
| FinnGen R13 | 2,754 | 8,680 | p ≤ 8.18e-5 | TSV |
Finding the results
MVP traits keep their existing pages: the PRISM models are listed next to the BLISS models at the top of each trait page. FinnGen R13 endpoints have new pages, with identifiers of the form finngen_R13_<endpoint> (for example finngen_R13_I9_VTE). The Phenotypes table has a Models column, and searching for a gene opens its PRISM and BLISS associations together.
How the results were computed
- Models. The final PRISM release (chongwulab/PRISM-models). Trans loci in pleiotropic hotspot regions, which carry pQTLs for many proteins at once, are excluded from every model.
- Test. Each protein's joint (cis + trans) model is tested with the effect-size form of the summary-statistics PWAS test, using the LD stored with each model. A positive effect means that a higher genetically predicted protein level is associated with a higher trait value or disease risk.
- Which proteins are tested. A model is tested when its R² is at least 0.01 and it has more than 10 SNPs (the Tested column).
- Significance. Benjamini–Hochberg false discovery rate of 5%, computed over all tested protein–trait pairs of one panel × cohort scan. The resulting p-value cutoffs are listed above and drawn as the dashed line on each Manhattan plot.
- Calibration in FinnGen. A model is set aside in FinnGen when its test statistics are inflated across the 1,041 endpoints with at most 500 cases (genomic-control λ > 2): 5 UKB-PPP and 38 deCODE models. Their results remain in the per-trait downloads, flagged.
- Plot positions. Each protein is drawn at the GRCh37 start of its encoding gene; several aptamers of one gene sit a few base pairs apart. The position is for display only.
Downloads
The Download association results button on every PRISM trait page gives one tab-separated file for that trait and panel. It lists every model, tested or not, with full-precision statistics: joint_* (the PRISM test), cis_* and trans_* (the two parts of the model tested on their own), each with beta, se, p, neg_log10_p, r2 and n_snp, plus tested, calibration_set_aside, q_fdr and significant. Where a p-value is too small to store (printed as 0), neg_log10_p, computed on the log scale, gives its true size. The six TSV links in the table above collect every significant pair of each scan.
Citation. Zhang Z*, Zhang W*, Wu C, Zhao B. PRISM: Proteome-wide Regression Integrating cis and trans pQTL Summary statistics across Multiple loci. Manuscript in preparation. (*equal contribution)
Note: PRISM code is on our GitHub page and the models are in our 🤗 Hugging Face repo.
Large-scale imputation models for multi-ancestry proteome-wide association analysis.
Proteome-wide association studies (PWAS) decode the intricate proteomic landscape of biological mechanisms for complex diseases. Traditional PWAS model training relies heavily on individual-level reference proteomes, restricting its capacity to harness the emerging summary-level protein quantitative trait loci (pQTL) data in the public domain. Here we introduced BLISS, a novel framework to train protein imputation models using only pQTL summary statistics. By leveraging extensive pQTL data from the UK Biobank, deCODE, and ARIC studies, we applied BLISS to develop large-scale European PWAS models covering 5,779 unique proteins. We further extended BLISS to integrate with small-scale non-European individual-level datasets, enabling the development of models tailored to Asian and African ancestries. We validated the performance of BLISS models through a systematic multi-ancestry analysis of over 2,500 phenotypes across five major genetic data resources. The newly identified protein-phenotype associations offer valuable insights into their cross-ancestry transferability, the contributions of different proteomic platforms, and the complementary perspectives provided by distinct genomic mapping approaches relevant to drug discovery.
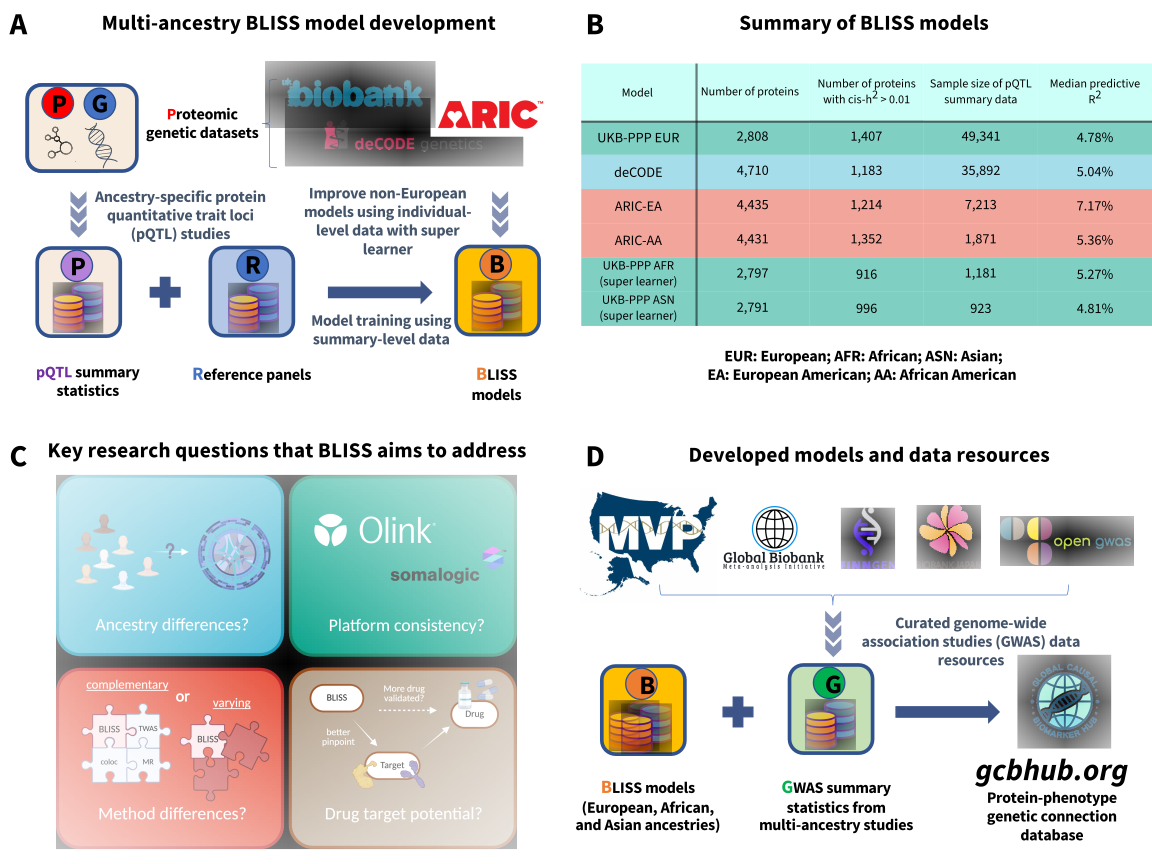
Note: BLISS code and developed models can be downloaded from our 🤗 Hugging Face repo. For the most current BLISS code, please refer to our GitHub page.
Team
GCB Hub aims to assemble a passionate team dedicated to open science, pulling together skills from a wide range of disciplines, including statistics, biostatistics, causal inference, epidemiology, drug development, clinical medicine, human genomics, as well as web and software development.
Leadership Team:
Chong Wu (MD Anderson) and Bingxin Zhao (UPenn)
Current and past members:
Zichen Zhang
 (MD Anderson),
Xiaochen Yang
(Purdue),
Wanheng Zhang
(MD Anderson)
Contact and license
We are dedicated to identifying causal biomarkers, including but not limited to proteins, genes (expression and splicing), and CpG sites, for complex traits and diseases in different domains. Resulting resources would enable to address many relevant scientific questions, and help researchers in pinpointing the most promising targets for subsequent functional analysis, drug development, and repurposing.
If you have QTL datasets or would like to deposit your summary statistics to GCB Hub, please feel free to reach out to Chong Wu and Bingxin Zhao.
This work is licensed under the CC BY-NC-ND 4.0 DEED.
Visitors
Countries shaded by total visitors · · updated hourly